Every year on the record. Including the one that hurt.
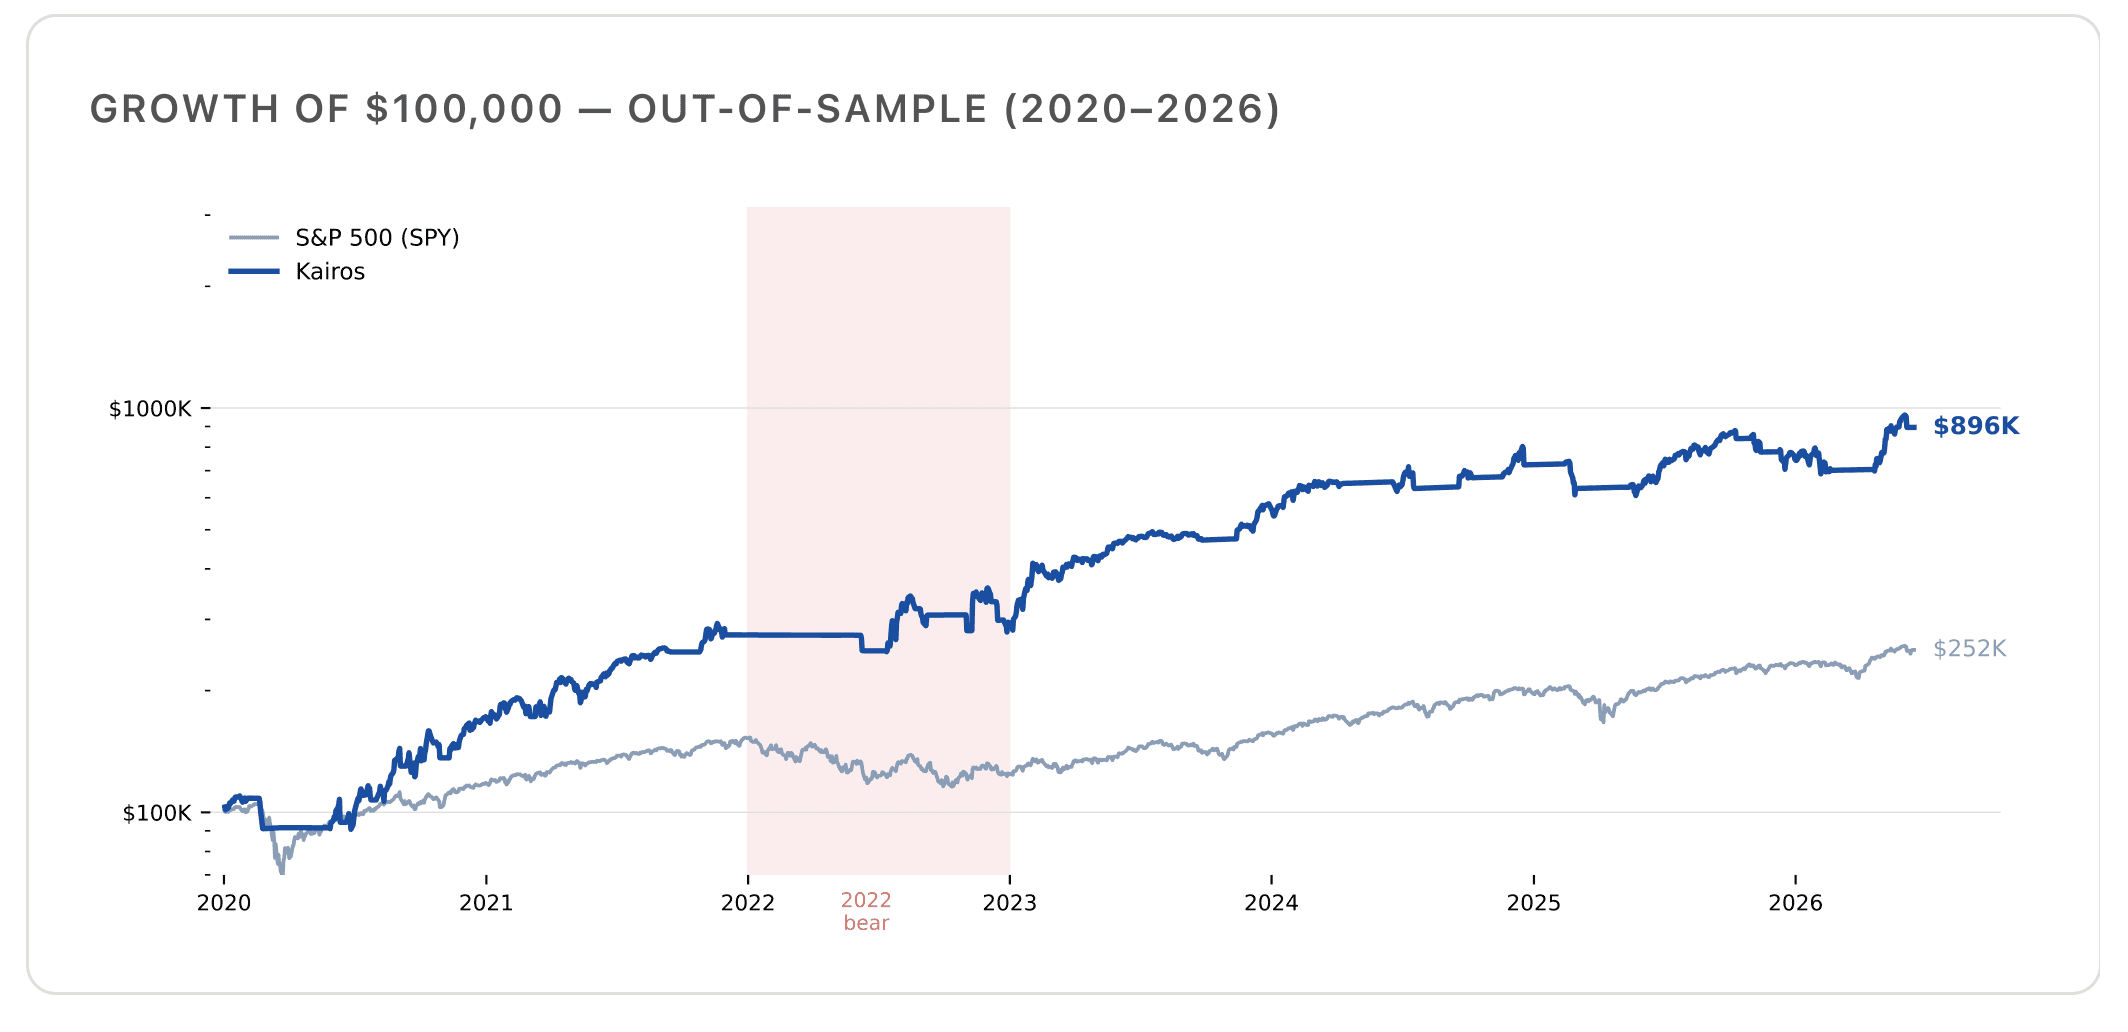
Out-of-sample results for the Kairos regime model, 2020 to mid-2026. The rules were locked before the window and never changed to fit the data. Hypothetical model performance: not audited, not client accounts.

- Annualized return. S&P 500: 15.5%.
- 40.6%
- Sharpe ratio. S&P 500: 0.81.
- 1.39
- Worst peak-to-trough drop. S&P 500: −33.7%.
- −24.5%
- What $100,000 became. S&P 500: $252K.
- $896K
Kairos regime model vs SPY, out-of-sample, 2020 through mid-2026. Source: Kairos strategy deck.
Same start date, different paths. The flat stretches are safety mode: the model holding T-bills while conditions were fragile.
Six years ahead, one behind. Tap a year to see both numbers, or switch to the table.
Calendar-year returns
Kairos regime model vs S&P 500, out-of-sample
- Kairos
- S&P 500 (SPY)
- 2020+72%+18%
- 2021+59%+29%
- 2022+8%−18%
- 2023+95%+26%
- 2024+26%+25%
- 2025+3%+18%
- 2026 YTD+20%+9%
Source: Kairos strategy deck. S&P 500 annual figures are read from the deck chart and rounded. Out-of-sample model results, not audited or client-account performance.
2022
The year it was built for.
Stocks and bonds fell together. The S&P 500 finished down about 18%. The model finished up 8%, not because it predicted anything, but because the five checks read fragile and the written rule said step aside.
2025
The year it cost us.
The S&P 500 made about 18%; the model made 3%. The same defenses that earned 2022 kept it cautious through what the source deck calls a steady no-pullback grind. We’d rather show you that year than hide it.
What it would have felt like to hold through it.
−24.5% worst drop
59% of days in the market
About 11 trades a year
72% of trades won
What this record is, and what it isn’t.
Out-of-sampleIt is
CostedIt is
CompleteIt is
Measured in real T-billsIt is
Not auditedIt isn’t
Not client accountsIt isn’t
Not a promiseIt isn’t
How the record was built.
- Strategy
- Kairos regime model. Growth mode: 83% TQQQ (about 2.5× effective Nasdaq exposure). Safety mode: 100% short-term U.S. Treasury bills.
- Window
- January 2020 through mid-2026. Out-of-sample: rules finalized before the window and never refit on it.
- Decision
- Five-factor regime score computed from public market data each trading day at 3:50 PM ET.
- Execution
- Near-close, with commissions and slippage modeled. SHV used as the T-bill proxy.
- Benchmark
- SPY (S&P 500 ETF), same start date.
- Not included
- Kairos fees, taxes, and differences in individual account timing or sizing.
- Newer systems
- Kairos Select and Kairos Enhanced have been tracked live as models since 30 September 2025: about a year, gross of fees and slippage, not audited. Too short to publish as a record; we walk through them on a call with that caveat said out loud.

Walk through these numbers with the person who built them.
Bring the questions a skeptic should ask: why 2025 lagged, what the worst drop felt like, what's modeled and what isn't. Thirty minutes, books open.
12 months to change your mind · no lock-up · no obligation
Important information
Hypothetical, out-of-sample model performance. Results do not reflect actual trading in client accounts, are not audited, and do not include Kairos fees or taxes. Model results have inherent limitations, including the benefit of hindsight in their design. Leveraged ETFs reset daily and can lose money in flat or volatile markets. Past performance does not guarantee future results. See disclosures.